This page contains extra resources and links related to my poster for DH2014: “Marked E-Books and Kindle’s Popular Highlight Culture.”
PDF of poster: DH2014 Poster
High quality image: Highlight lengths
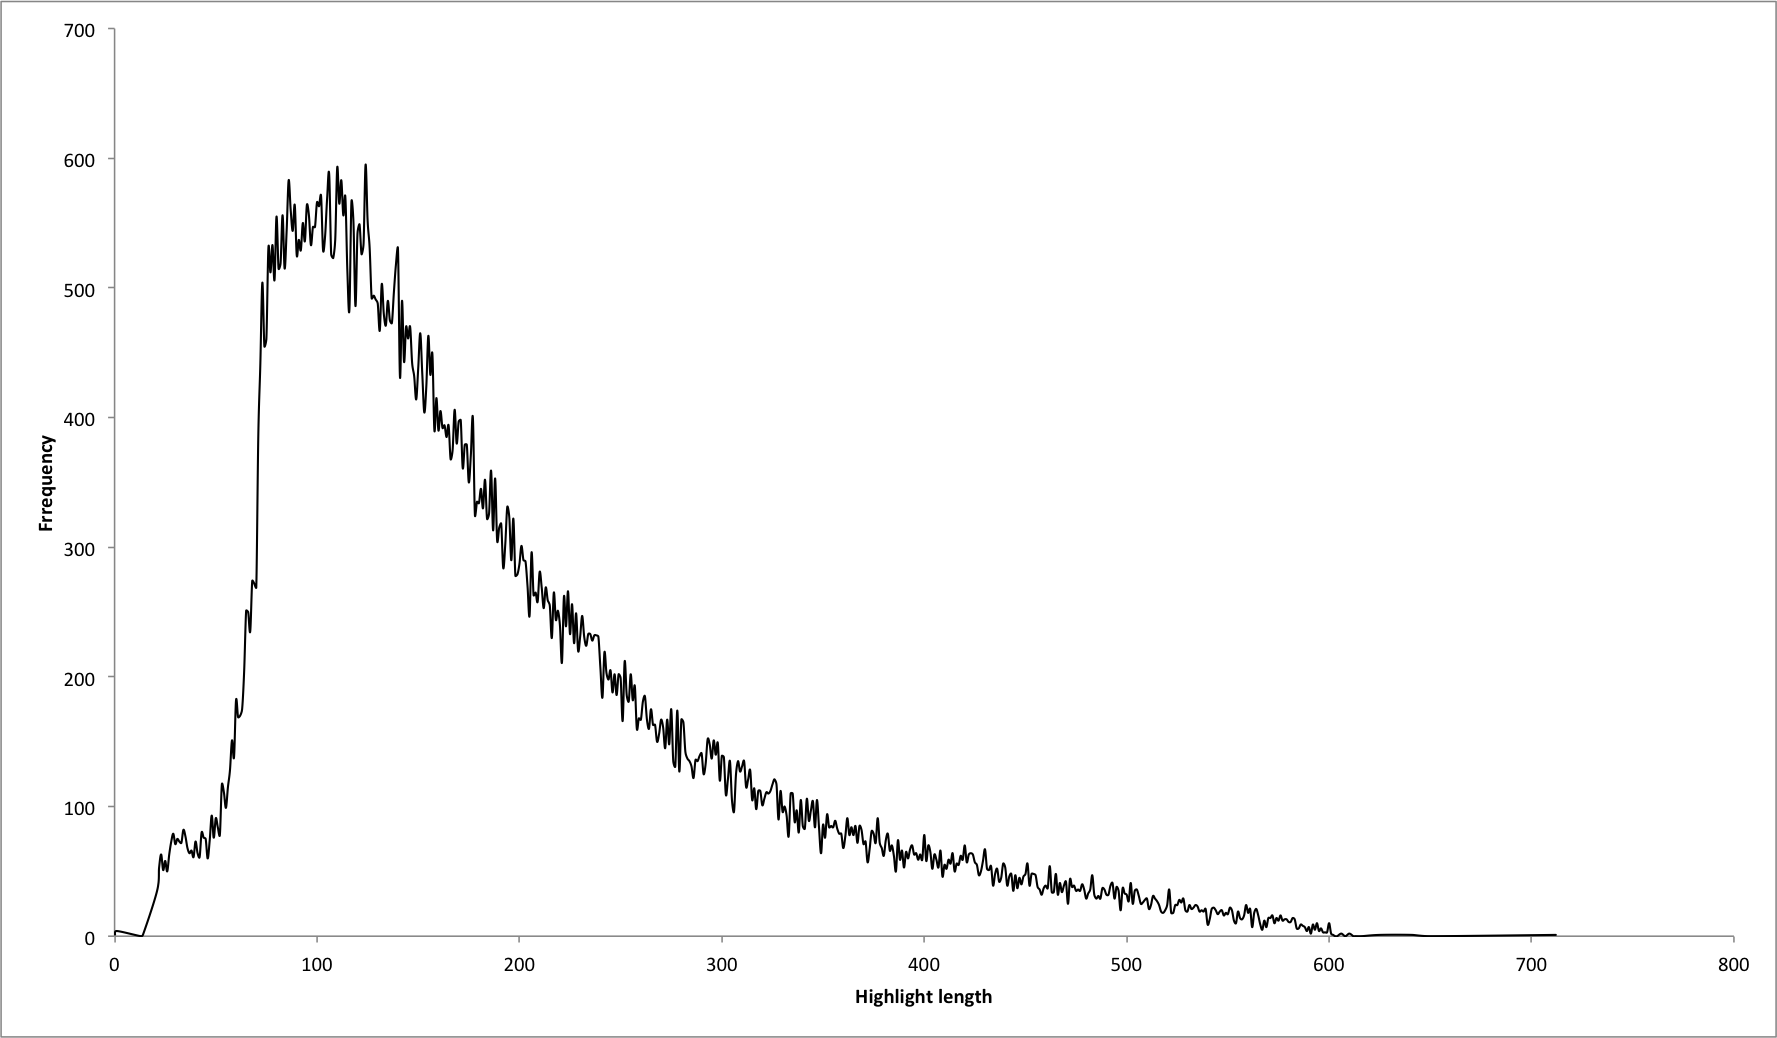
Further discussion of why Kindle:
While other eBook providers offer facilities for highlighting and annotating eBooks, they tend not to have the same infrastructure and focus on user-generated content. For example, the Nook has no option to share highlights or even have a back-up on the Barnes & Nobles’ server. When highlights can be shared, such as on Readmill, this data is ephemeral, and as with the example of Readmill, may disappear at any time. Since the launch of the Kindle, Amazon’s mindset has been the book-as-service, rather than book-as-object, so the company with the best provisions for continual service—in this case Amazon—naturally offers the service with the most reliable results.
Unfortunately, as Amazon is the prime mover and a commercial entity, they are not necessarily geared up towards researching their data. There is no API, so there is no straightforward way of accessing the data Amazon have collected on readership on the Kindle. Moreover, this is spread between multiple sites, including but not limited to: the Kindle website, GoodReads, Twitter and Shelfari. While the lack of API creates friction in the data collection process, the Robots.txt files for these sites demonstrate that Amazon are amenable to the type of data mining required in analysing this data. The only exception to this comes in the form of the annotations for particular books, as this data is only available on the level of the individual and obfuscated from easy extraction despite providing valuable evidence of individual reader response.
More on the type of books in the corpus:
The top 100,000 highlights are more homogenous than the remaining 900,000 records as they represent only the most popular titles rather than more esoteric and niche genres. Nonetheless, the data provides enough evidence of an archetypal Kindle reader’s generic interests. The Hunger Games series is perhaps over represented in the corpus due to its position as one of the first major Young Adult fiction success stories to occur primarily in the eBook era (i.e. after 2007), while other popular series such as Twilight straddle the print-eBook divide more. Many readers only ever encountered The Hunger Games series on their Kindles.
Outside of fiction, the highlights become more interesting. The presence of shared highlights of calendars, word searches and titles in the dictionary was surprising, but these are the minority of highlights compared to shared quotations from self help books. These account for over 50% of non-fiction works in the corpus, followed by biographies, with other types of non-fiction barely represented in the corpus. The quotations take the form of aphorisms or instructions, demonstrating that the reader wants to encourage other readers of that particular text.
The problem of representation:
While the data offers an interesting insight into what an unknown subset of readers are interested in when reading on their Kindle, a drawback is it is impossible to ascertain more information about this group or their presence within the larger body of Kindle readers. There is no granularity in the data, and no way to drill down to a single user, as has been done in wonderful case studies into print marginalia such as William Sherman’s Used Books and H.J. Jackson’s Marginalia. Such work requires examination of individual’s eBooks, a method that raises another set of complex issues.
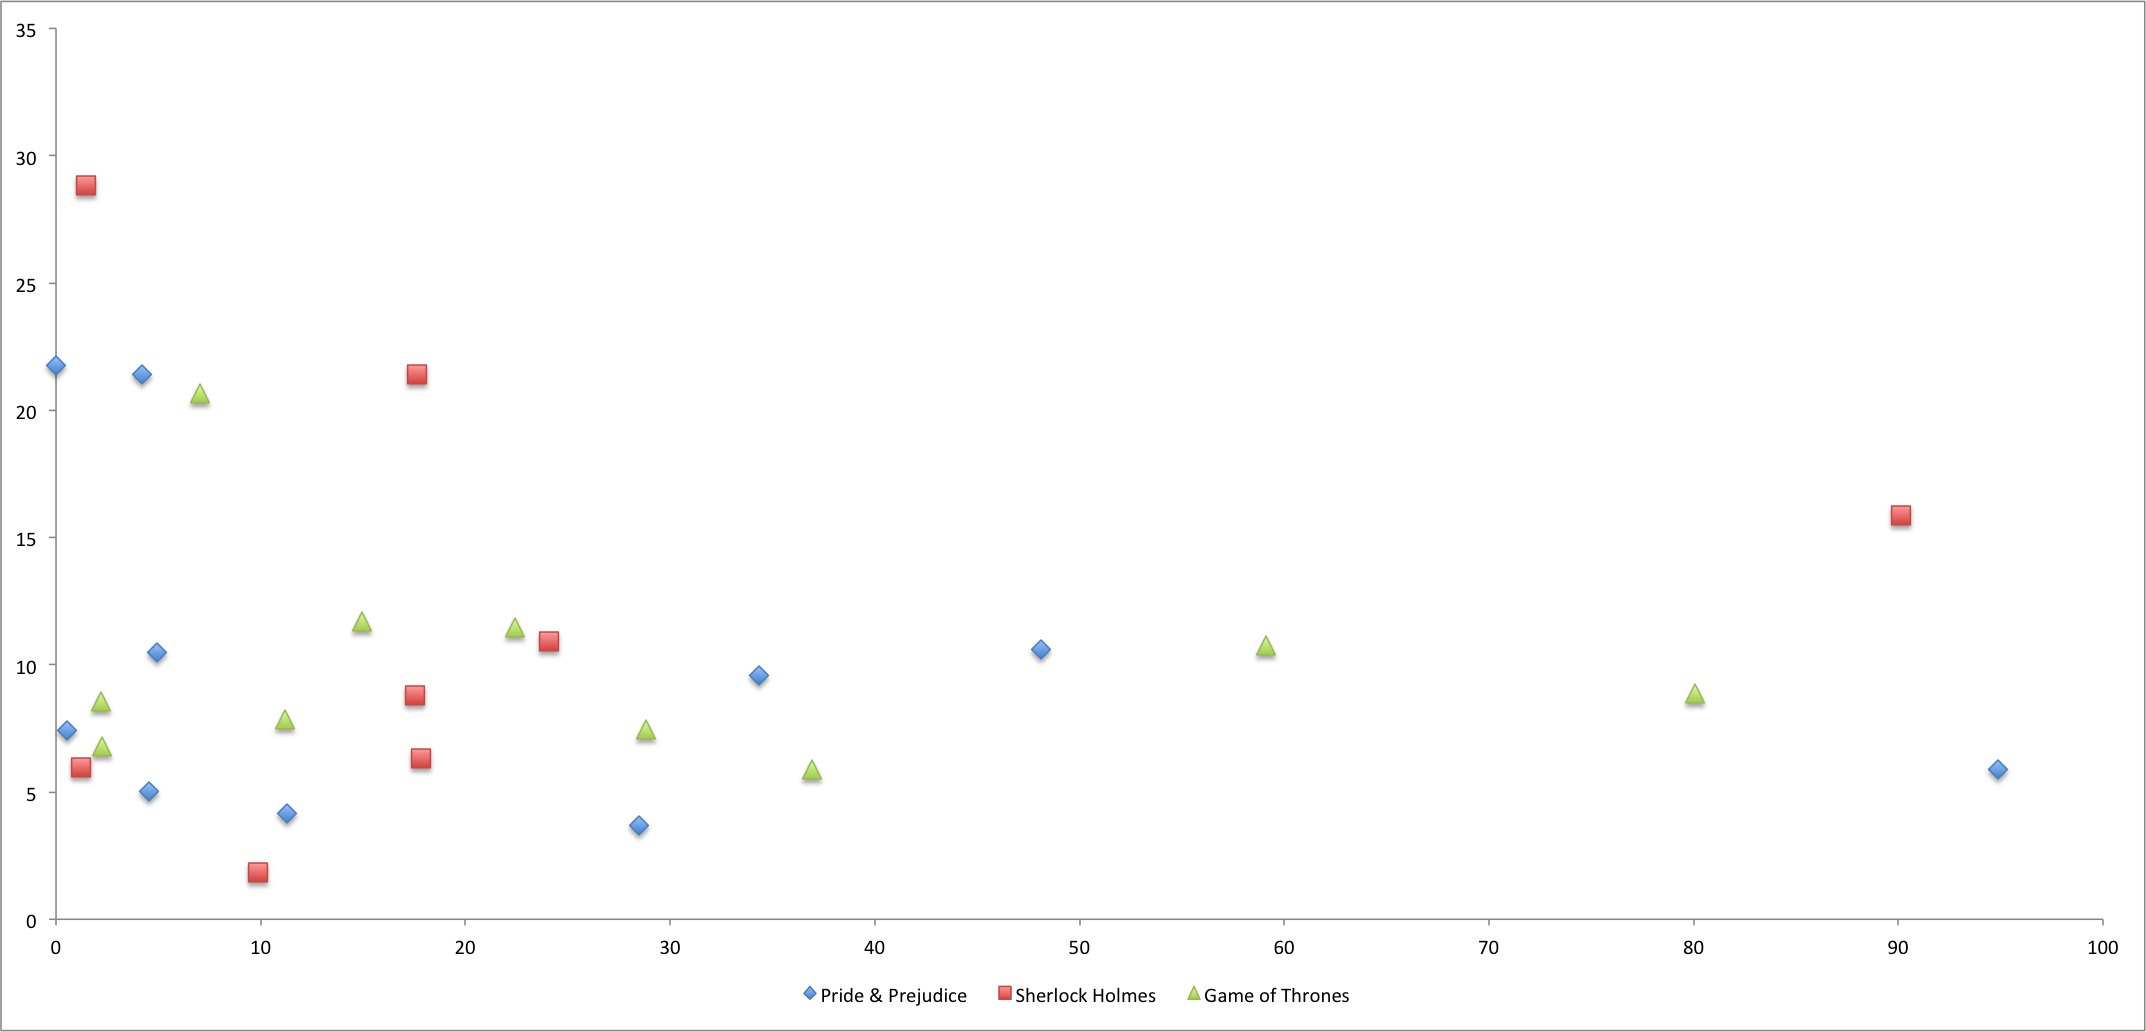
What about the “Hawking Index”?
Recently, Jordan Ellenberg came up with a rough calculation to show that Thomas Piketty’s Capital in the 21st Century was more bought than read, which he termed the “Hawking Index.” Ellenberg treats the distribution of the five most highlighted passages as representative of how far the majority of readers got through the book. While Ellenberg acknowledges that the index is for entertainment purposes rather than rigorous analysis, I had thought of a similar hypothesis early in the development of the Kindle project: if we map relative highlight volume against their relative location, this might show deterioration as the book goes on, to show potentially where readers gave up. Unfortunately, there were three problems with this method: (1) you have to buy the books to get this data; and (2) many books do not have significant enough data to give worthwhile results; and (3) with more data, there might be evidence that readers simply highlight the beginning (and to a lesser extent, the end) of every book more than the rest, regardless of how much of the book they have read. The graph below outlines the initial results (click for full size).